一文让你学会断点调试
❝开发过程中难免会有遇到未知的错误,指定不能一点点的调试吧!这篇文章带你使用atom来调试程序。如有任何问题,评论区回复即可。
❞
一、在atom安装php-debug
点击file->settings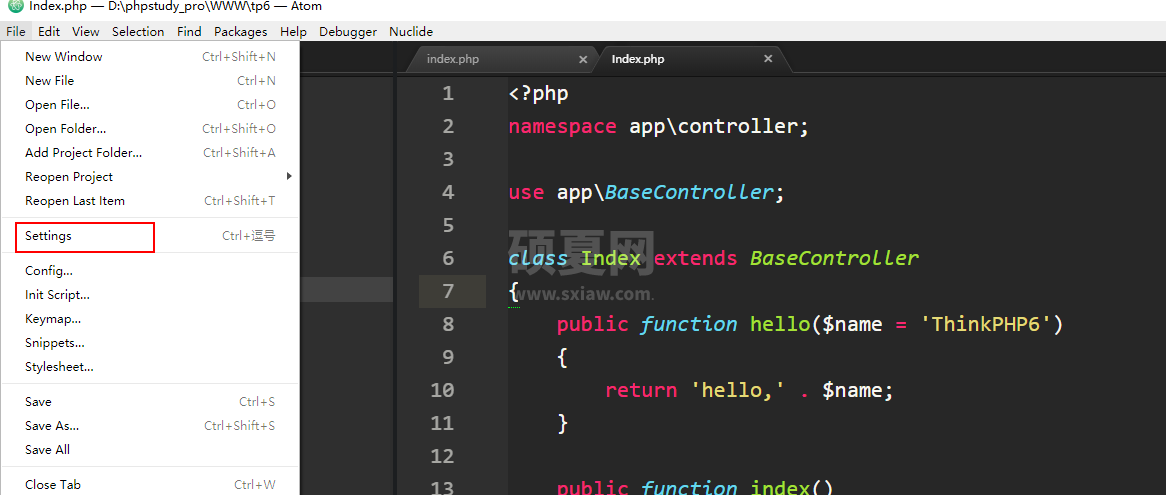 然后点击install,搜索php-debug,这里的搜索如果出不来就需要想办法了哈!要学会科学上网哈!
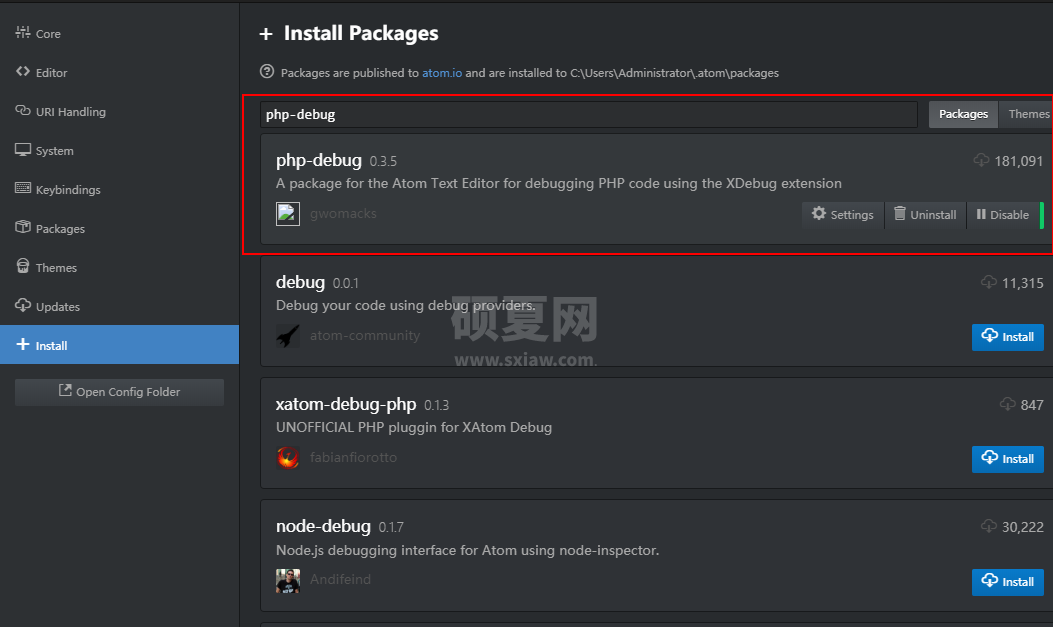 安装成功就是这样的
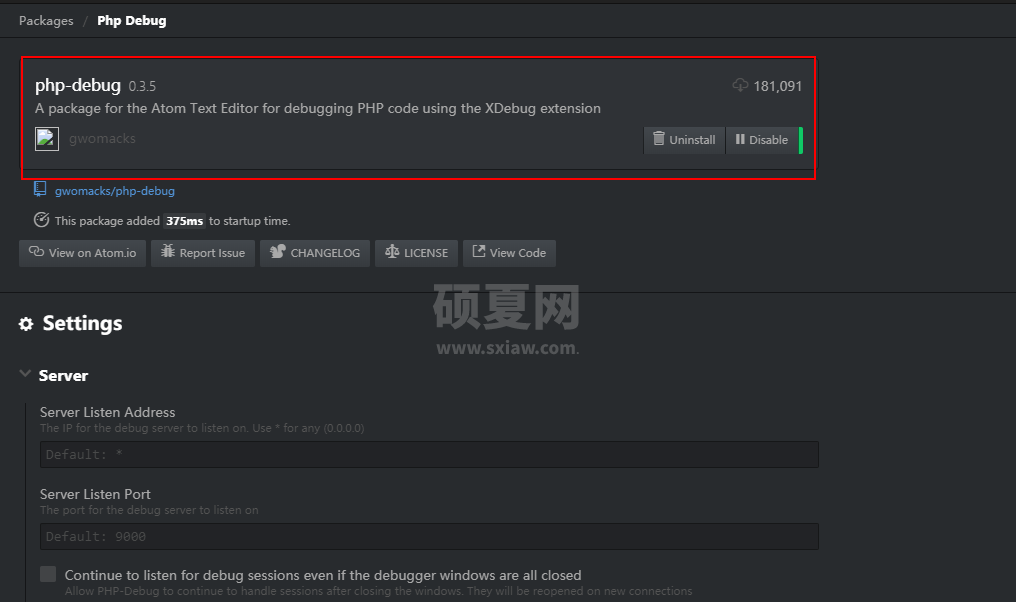
二、下载Xdebug
下载地址:https://xdebug.org/download,打开地址后可以看到扩展,咔咔这里安装的是php7.3的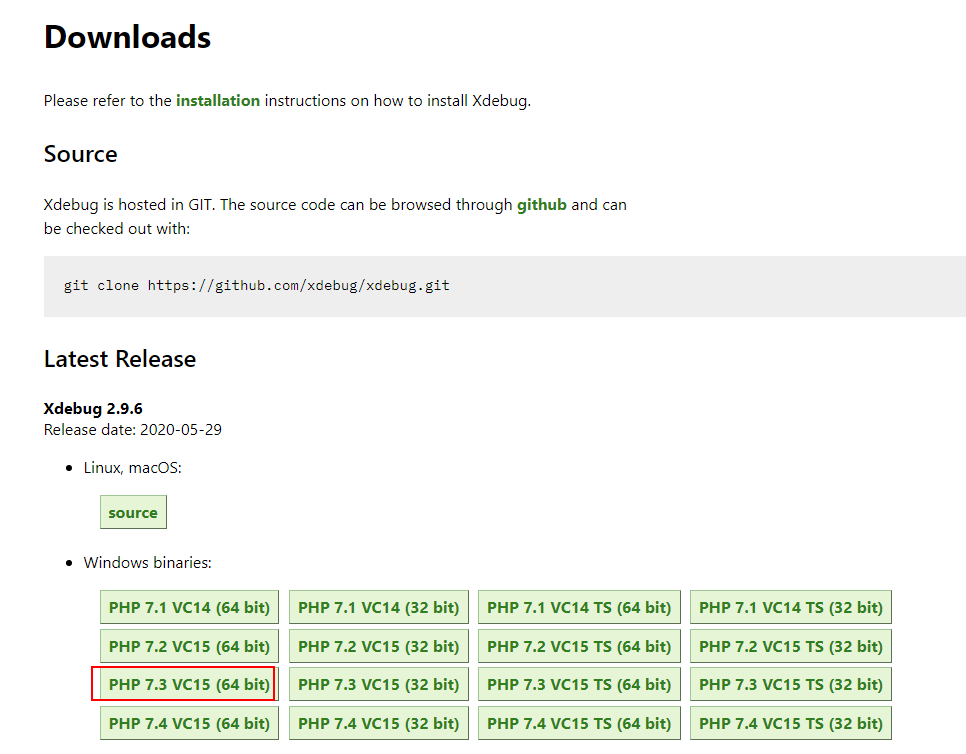 但是有俩个php7.3选择那个呢!打开你的PHP环境可以看到框里的vc15
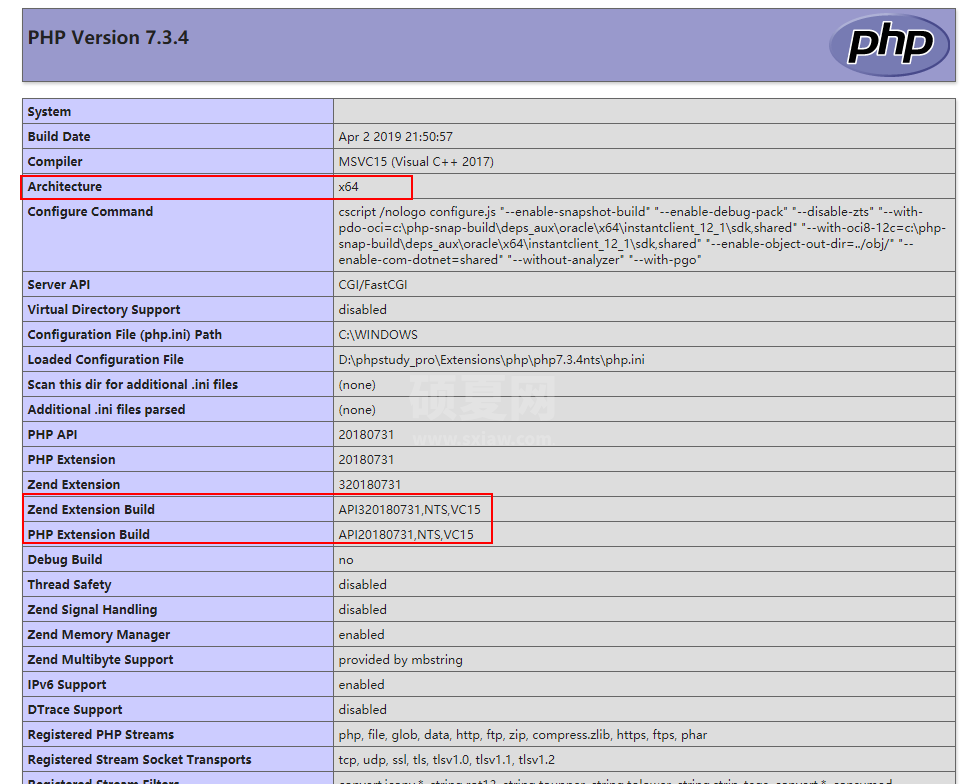 然后把下载的文件放到
D:\phpstudy_pro\Extensions\php\php7.3.4nts\ext,这里是咔咔的地址。就是放到你们自己的PHP环境里边即可。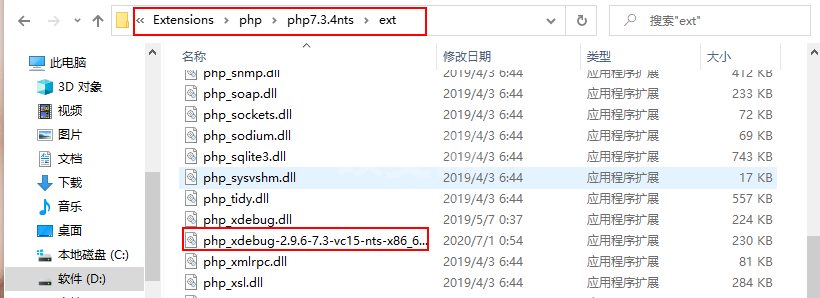
三、配置
然后找到你的php.ini文件,将下面的配置复制进去。记得需要修改zend_extension的位置。
这个位置跟你的PHP位置有关系。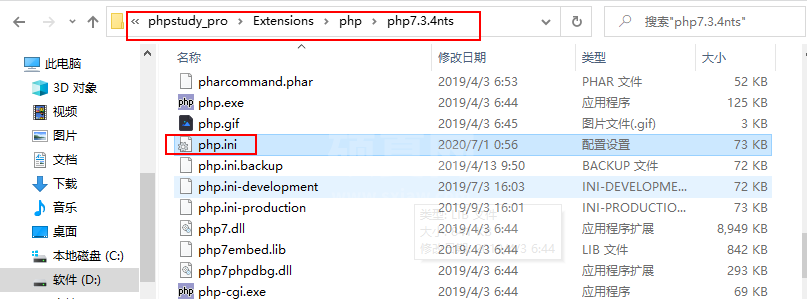
<span style="display: block; background: url(https://imgkr.cn-bj.ufileos.com/97e4eed2-a992-4976-acf0-ccb6fb34d308.png); height: 30px; width: 100%; background-size: 40px; background-repeat: no-repeat; background-color: #282c34; margin-bottom: -7px; border-radius: 5px; background-position: 10px 10px;"></span><code class="hljs" style="overflow-x: auto; padding: 16px; color: #abb2bf; display: -webkit-box; font-family: Operator Mono, Consolas, Monaco, Menlo, monospace; font-size: 12px; -webkit-overflow-scrolling: touch; letter-spacing: 0px; padding-top: 15px; background: #282c34; border-radius: 5px;">[Xdebug]<br>zend_extension = D:\phpstudy_pro\Extensions\php\php7<span class="hljs-number" style="color: #d19a66; line-height: 26px;">.3</span><span class="hljs-number" style="color: #d19a66; line-height: 26px;">.4</span>nts\ext\php_xdebug<span class="hljs-number" style="color: #d19a66; line-height: 26px;">-2.9</span><span class="hljs-number" style="color: #d19a66; line-height: 26px;">.6</span><span class="hljs-number" style="color: #d19a66; line-height: 26px;">-7.3</span>-vc15-nts-x86_64.dll<br>xdebug.remote_enable = On<br>xdebug.remote_host = localhost<br>xdebug.remote_port = <span class="hljs-number" style="color: #d19a66; line-height: 26px;">9000</span><br>xdebug.remote_handler = dbgp<br>xdebug.idekey=xdebug-atom<br></code>
这个位置如何确定呢!如果你使用的是新版的phpstudy,D:\phpstudy_pro\Extensions\php\php7.3.4nts\ext那就是这个位置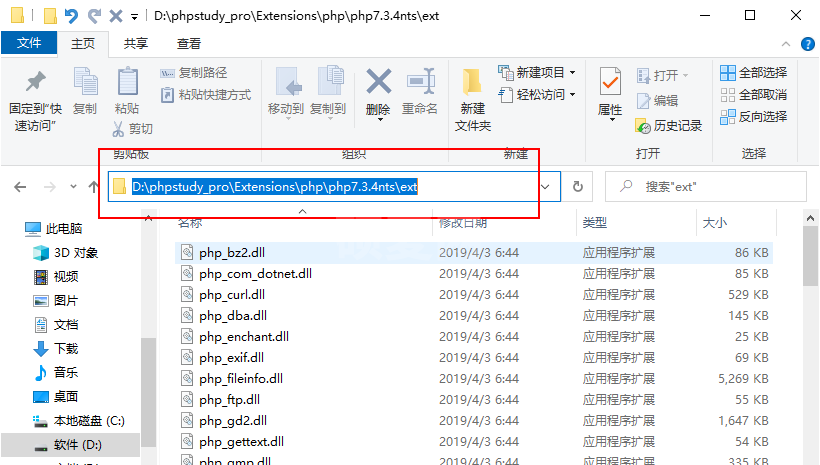 如果你是旧版本的phpstudy位置在
C:\phpStudy\PHPTutorial\php\php-7.1.13-nts\ext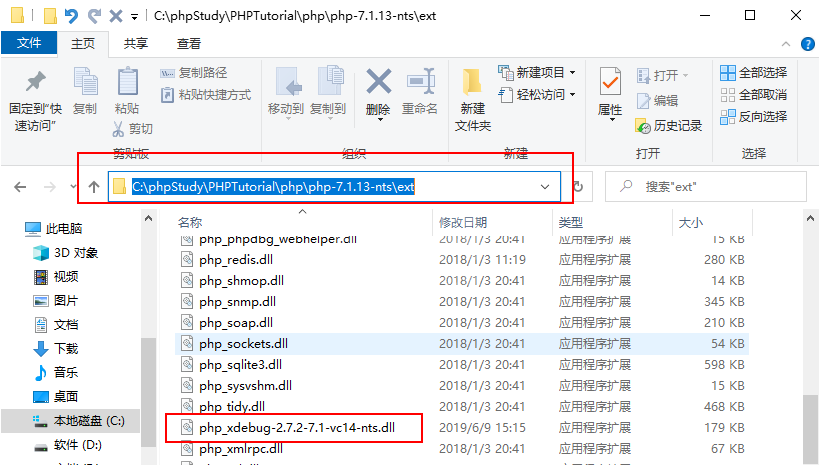
四、测试
以上工作完成之后切记需要重启一下环境。
这个时候需要做俩件事。
第一打开atom的debug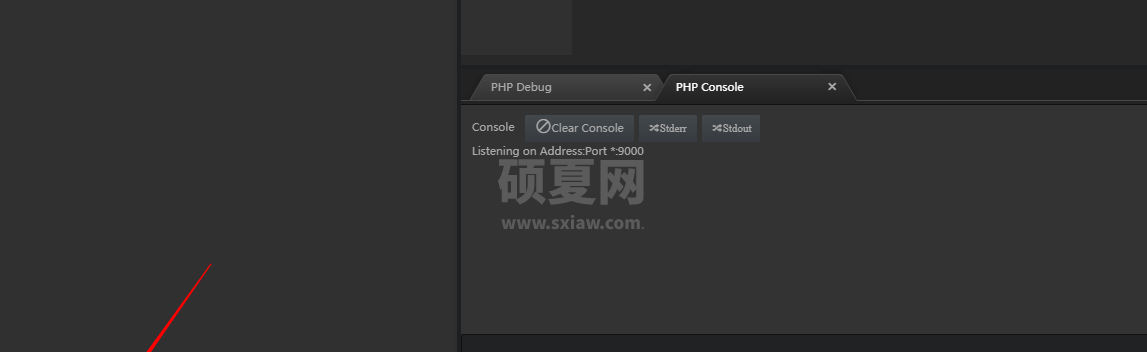
第二在地址栏输上地址http://localhost/index.php?XDEBUG_SESSION_START=1这里注意后边的参数。
此时就会出现一个弹框,地址填写为你的项目路径即可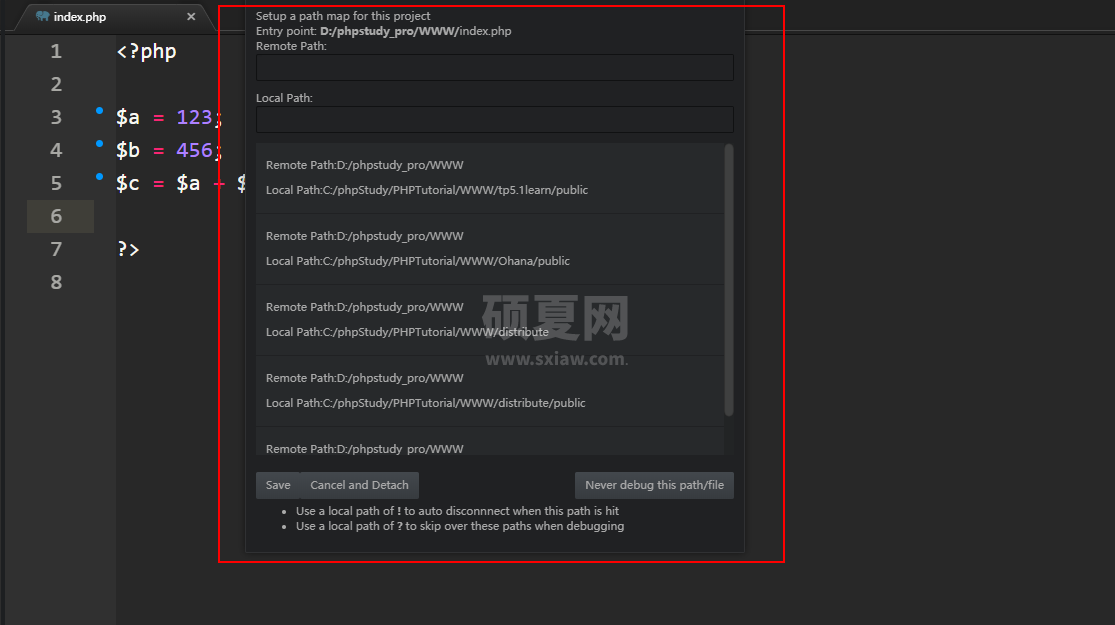 这个时候调试面板就出来了,可以看到我们的变量值已经打印出来了。
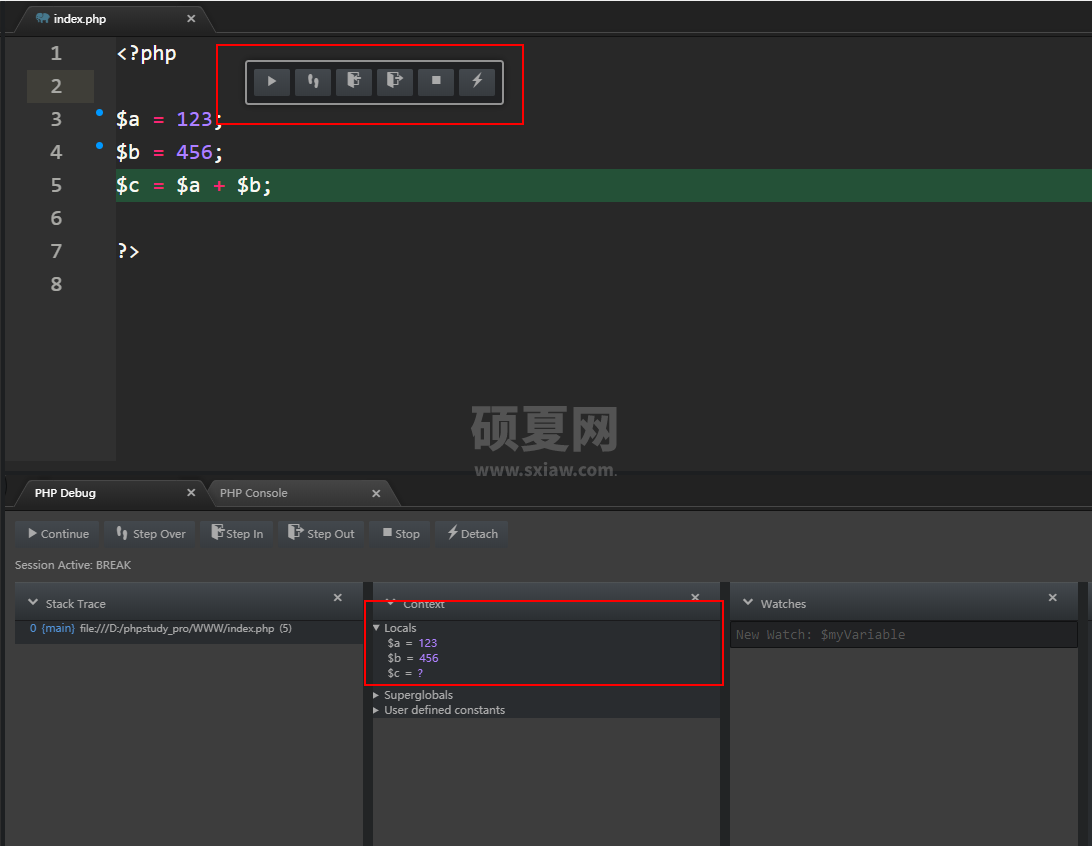 直到这里我们的断点调试就完成了。
五、总结
配置断点的重要步骤汇总。
atom下载php-debug 下载xdebug并放到对应的PHP扩展里边 地址栏访问需要携带 ?XDEBUG_SESSION_START=1atom配置路径时切忌看好项目路径的用的是正斜杆

以上就是一文让你学会断点调试的详细内容,更多请关注www.sxiaw.com其它相关文章!